Most teams treat authorization as something that either works or doesn't. A request comes in, a decision goes out, and as long as nobody is locked out of something they should see, nobody thinks about it again. That works right up until the moment something changes. A policy gets tightened, a new service starts making calls, a client ships a typo in a resource name, and suddenly the shape of your authorization traffic looks nothing like it did last week. The problem is that most people have no way to see that shape in the first place.
That's the gap Cerbos Hub Insights closes. It's a new page in every workspace that turns the decisions flowing through your PDPs into a set of charts and rankings, so you can see at a glance what your authorization layer is actually doing in production.
View the documentation here.
From individual decisions to the bigger picture
Cerbos Hub already gives you a detailed audit log of every decision your PDPs make. That log is the right tool when you need to answer a specific question about a specific request. Who was denied, what were they trying to do, and which policy made the call.
What it doesn't do well is tell you about patterns. Scrolling through thousands of individual log lines isn't how anyone spots that denials have crept up since Tuesday, or that one principal is responsible for half the traffic in the workspace. Insights takes the same decision data and aggregates it, so the patterns become obvious without you having to go looking for them.
What you can see
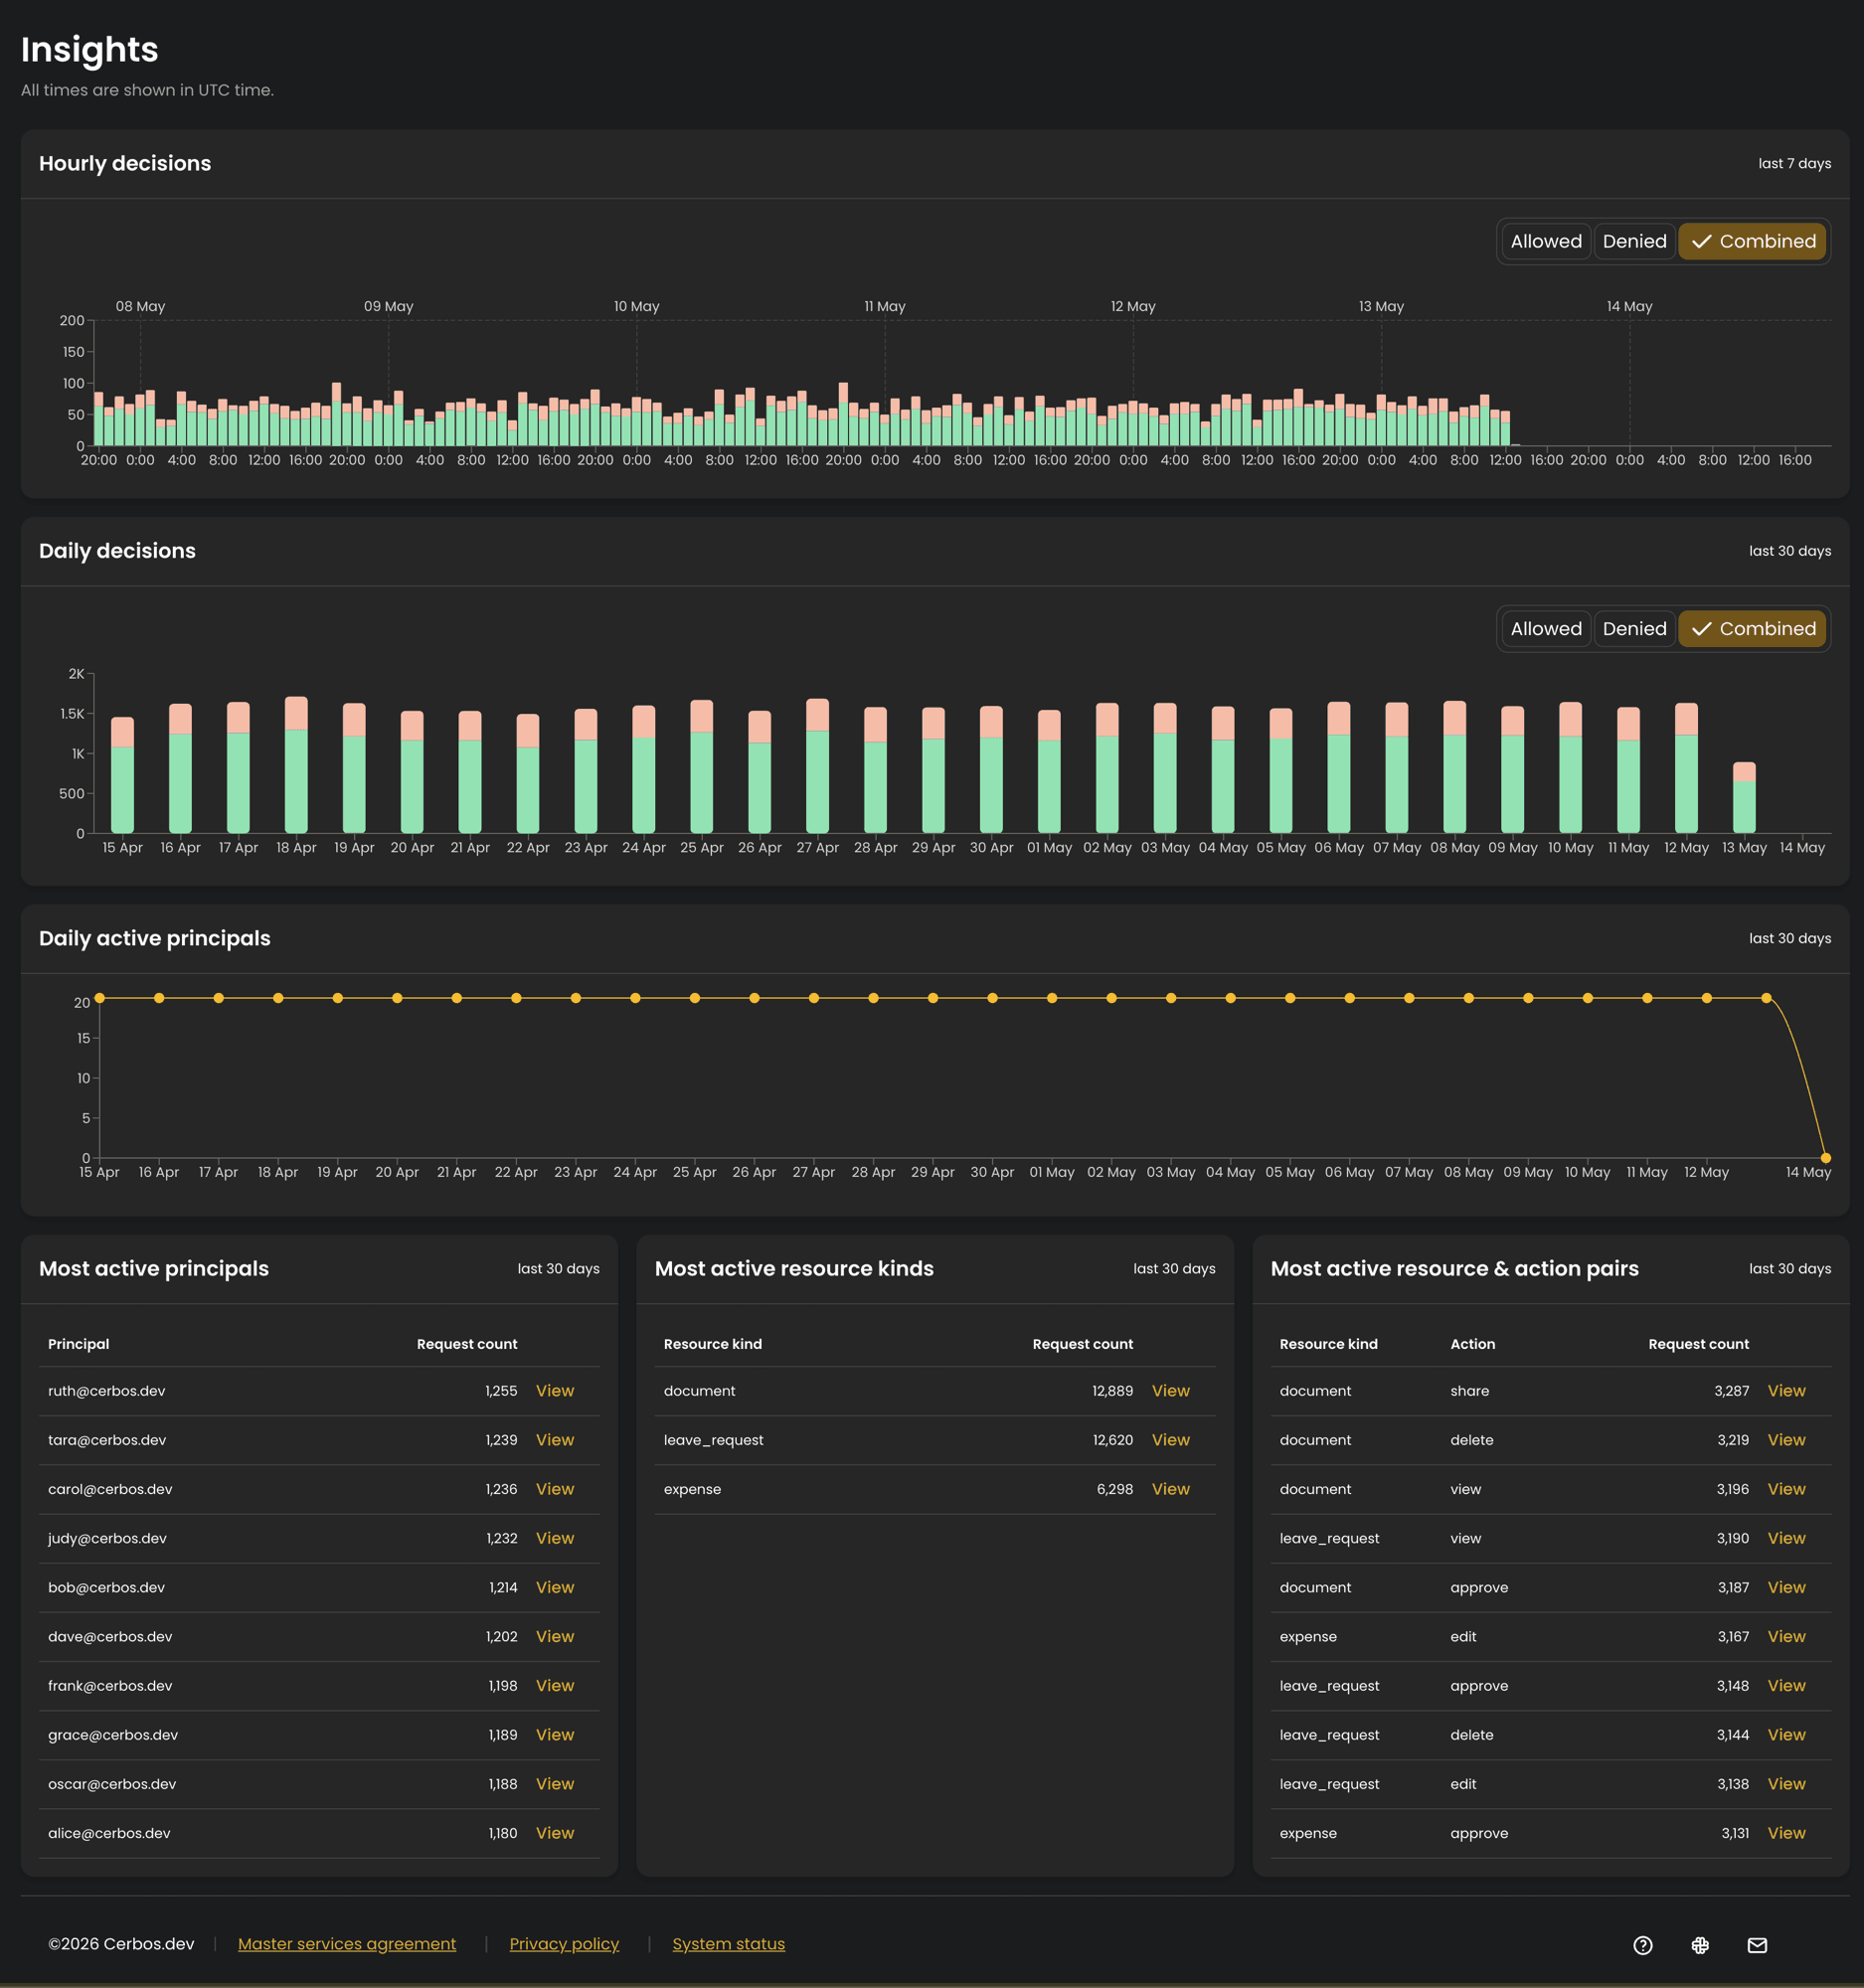
The top of the page is about decisions over time. There's an hourly view covering the last seven days, which is the one you reach for when something just happened and you want fine-grained detail. Below it, a daily view over the last thirty days smooths out the noise and makes longer trends easier to read. Both break decisions down into allows and denies, and you can toggle between showing allows, denies, or both overlaid.
The split between allows and denies is where a lot of the value sits. A sudden jump in denials is rarely random. It usually means a policy change landed that was stricter than intended, a client is asking for something that no longer exists, or an application bug is sending malformed requests. Seeing that jump on a chart is the difference between catching it in minutes and hearing about it from a frustrated user days later.
Alongside the decision charts is a daily count of active principals, so you can track how adoption of your authorization layer is growing over time and notice unexpected drops.
The rest of the page is about ranking the busiest things in your workspace over the last thirty days. There's a table of your most active principals, one for the most active resource kinds, and one for the most common resource and action pairs. Together they answer the question of what is actually being checked, in order of how often. The resource and action view is the most specific of the three, showing you the difference between, say, viewing an album and deleting one.
Built on data you're already collecting
There's nothing new to wire up. Insights is built entirely from the decision data your PDPs already send to Cerbos Hub, so once audit log collection is enabled and decisions start arriving, the page populates on its own. The charts also link straight back into the audit log, pre-filtered to match what you're looking at, so when something on a chart catches your eye you can drop into the underlying decisions without rebuilding the filter by hand.
Because Insights is built on audit data, it follows the same access rules. The page is only visible to workspace members who can view audit logs, which means the Owner and Analyst roles. If you don't have audit log access, the Insights tab won't appear in your workspace navigation. That keeps decision-level visibility in the hands of the people who are meant to have it.
Try it
Insights is available now in every Cerbos Hub workspace with audit log collection enabled.
Open Cerbos Hub to see it on your own traffic, or book a call if you want to talk through how you're using authorization data today.
FAQ
Tagged in