Authorization debugging just got easier. We're shipping two features that tackle problems we've heard about repeatedly from customers running Cerbos at scale: understanding why specific authorization decisions were made and getting visibility into usage patterns across multiple teams.
See exactly how policies evaluate with execution traces
Anyone who's debugged complex authorization logic knows the pain. You're staring at a policy that should grant access, but the request gets denied. Or worse, access is granted when it shouldn't be. The policy looks correct, the test passes in isolation, but something's off in production.
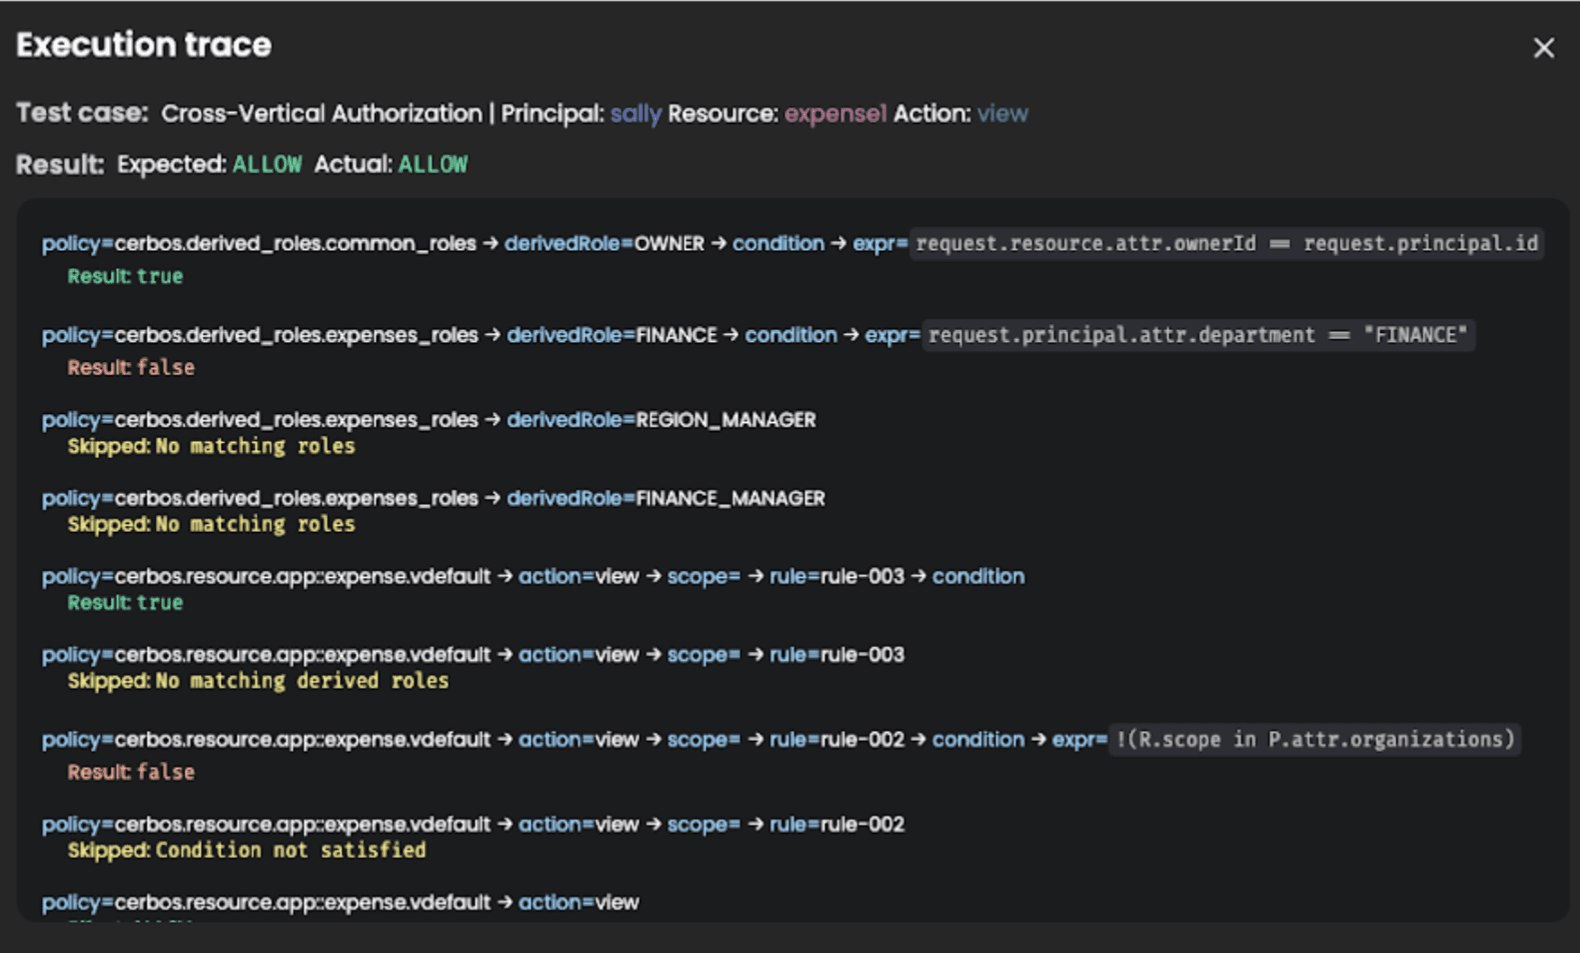
Policy execution traces solve this by showing you every single step Cerbos takes when evaluating a request. Each rule, each condition, and each variable evaluation appears in a detailed trace. You can follow the exact path through your policy logic and pinpoint where things diverge from expectations.
The traces appear in two places where you need them most. During development, they're available right in the playground as you test different scenarios. No more guessing why a particular principal-resource-action combination produces unexpected results.
When you deploy, the same traces are accessible in your deployment builds, giving you production-level visibility into how policies execute.
What makes this particularly useful is seeing how derived roles and scoped policies interact. We've had customers with policies spanning hundreds of rules discover that a derived role wasn't matching because of a subtle condition they'd forgotten about three sprints ago. The trace showed the exact condition that failed, turning a potentially hours-long debugging session into a five-minute fix.
The level of detail goes deep. You'll see variable assignments, expression evaluations, and the specific values being compared at each decision point. If a policy checks whether request.principal.attributes.department == "engineering", the trace shows you what the actual department value was and why the comparison failed.
Monitor authorization usage across your entire organization
Individual workspace metrics tell part of the story. But when you're running Cerbos across multiple teams, environments, and projects, you need the full picture. The new organization usage view aggregates metrics from all your workspaces into a single dashboard.
This builds on the workspace usage dashboard we released last month, which gave teams visibility into their own authorization patterns. Now you can see authorization request volumes, policy distribution, and usage trends across your entire organization. Engineering leaders get the data they need to understand adoption patterns and identify which teams might need additional support.
The rollup view preserves granularity where it matters. You can still drill down into specific workspaces to understand their unique patterns, but now you also get organization-wide totals and trends. This helps answer questions we hear from platform teams all the time. Which services are most heavily using Cerbos? Are certain teams hitting unusual request volumes? Are any authorization calls becoming a bottleneck anywhere?
Usage patterns often reveal optimization opportunities. One customer discovered that a single workspace was generating 90% of their total authorization requests due to an inefficient polling pattern. These insights only become visible when you can see the complete picture.
The dashboard updates in real-time, pulling data from all connected workspaces. You'll see request counts, unique principal and resource combinations, and policy evaluation metrics. Historical data lets you track growth patterns and spot anomalies before they become problems.
Available now in Cerbos Hub
Both features are live in Cerbos Hub today. Execution traces work immediately for any policy you're testing or have deployed. The organization usage view appears automatically if you have multiple workspaces, aggregating data from all of them.
These features came directly from customer feedback about debugging and monitoring challenges. Execution traces address the "why did this decision happen" question that every developer faces when working with complex authorization logic. Organization usage views answer the "what's happening across all our teams" question that platform owners and engineering leaders need answered.
If you're already using Cerbos Hub, head to the playground to try execution traces or check your dashboard for the new organization view. If you're not using Cerbos Hub yet, you can sign up for free and see both features in action with your own policies.
Tagged in