In any production system, observability is key. For an authorization layer that is central to your application's security and functionality, understanding usage patterns, performance, and decision outcomes is critical. Hardcoding this logic or relying on scattered logs is not a scalable or manageable solution. Modern applications require a centralized, insightful view of their authorization metrics.
To address this, we are excited to launch the new Usage Dashboard in Cerbos Hub. This new feature provides a comprehensive, real-time view of your authorization service, allowing you to monitor key metrics, analyze trends, and gain valuable insights into your policies and their consumers.
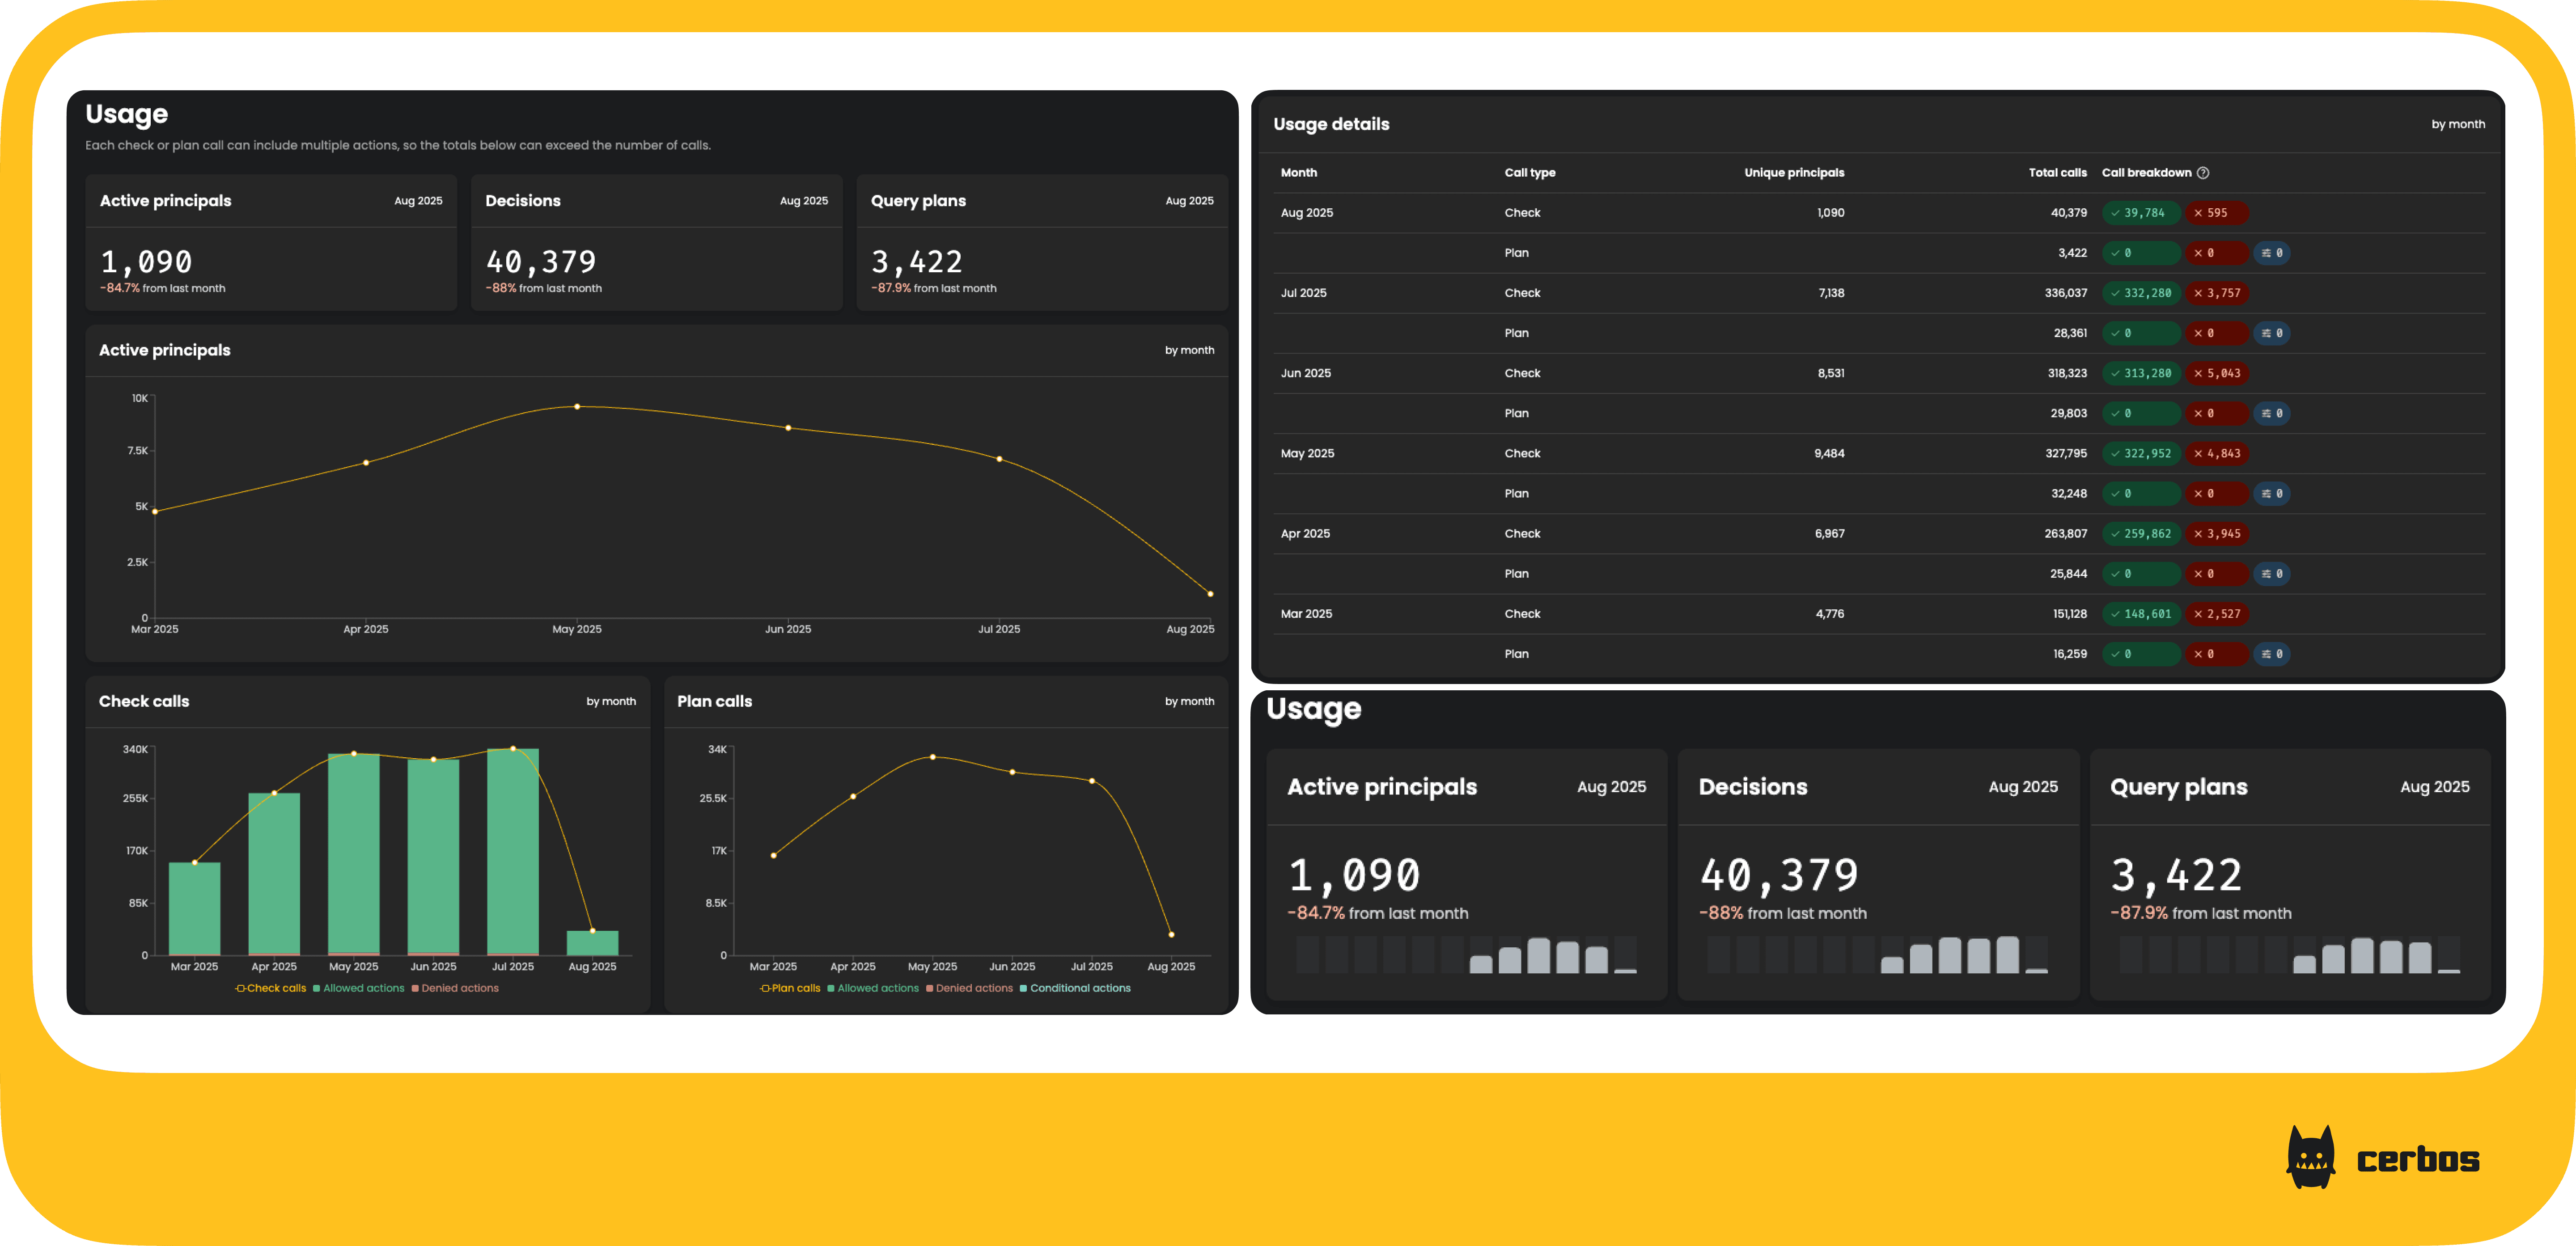
The new usage insights, available on both the workspace homepage and its own dedicated "Usage" section, surface these key metrics into a quick reference dashboard. It provides a detailed breakdown of your Monthly Active Principals (MAPs), decisions, query plans, and more, allowing you to see exactly how your authorization policies are being used.
Key metrics
The dashboard provides several key widgets, each designed to give you a specific insight into your authorization layer:
- Active principals. This tracks the number of unique principals that trigger policy evaluations. Monitoring this helps you understand user activity and capacity planning for your Cerbos PDP instances.
- Decisions. See the total volume of authorization decisions being made over time. This is a direct measure of your authorization workload and can help you spot trends and anomalies.
- Query plans. For users of Cerbos' advanced query planning features, this metric provides insights into the number of query plans being compiled, helping you understand the complexity and usage of your data-aware policies.
- Check calls. Analyze the volume of
CheckAPI calls, with a clear breakdown ofAllowedvs.Deniedoutcomes. A sudden spike in denied calls could indicate misconfigured policies, application bugs, or even security probes. - Plan calls. For those using query plans, this chart shows the usage of
PlanAPI calls, breaking down the responses intoAllowed,Denied, andConditionaloutcomes. This is crucial for understanding the behavior of policies that dynamically generate database queries.
Granular details for deeper analysis
Below the high-level charts, the "Usage details" table provides a granular, month-by-month breakdown of your authorization calls. You can see the exact number of Check and Plan calls, the number of unique principals involved, and the total calls, giving you a comprehensive historical view of your usage.
This is just the beginning
This initial release of the Usage Dashboard is the first step towards providing comprehensive observability into your authorization layer. We are committed to expanding our capabilities and would love to hear from you. What other metrics would you find valuable? How can we make this dashboard an even more powerful tool for managing your authorization policies?
Log in to your Cerbos Hub workspace to explore the new Usage dashboard today. Your feedback is invaluable as we continue to evolve Cerbos to meet the needs of developers building modern, secure applications.
If you’re interested in implementing externalized authorization - try out Cerbos Hub or book a call with a Cerbos engineer to see how our solution can help streamline access control in your applications.
Tagged in